今天,澳洲统计局(ABS)公布了2016年最新的人口普查(CENSUS)结果,这恐怕是一个里程碑,因为所有的数据都显示,澳洲的亚裔人口将很快赶超欧洲人,亚裔将成为澳洲最大的族群!
澳姐总结了66个数据,带你看看一个最真实的澳洲!
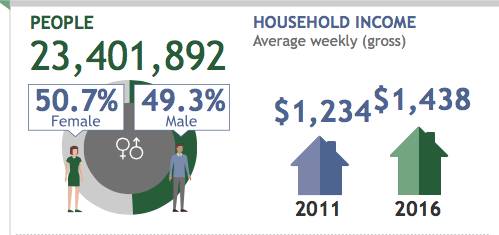
1、澳洲总人口数量相比2011年人口普查时增加了8.8%,达到23,401,892人。
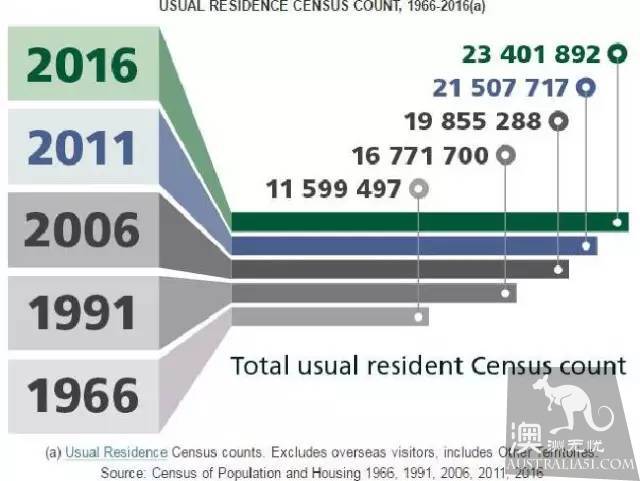
2、如果加上人口普查时在海外旅游的人数,那么澳洲人口已经突破2440万大关,比预期早了17年。

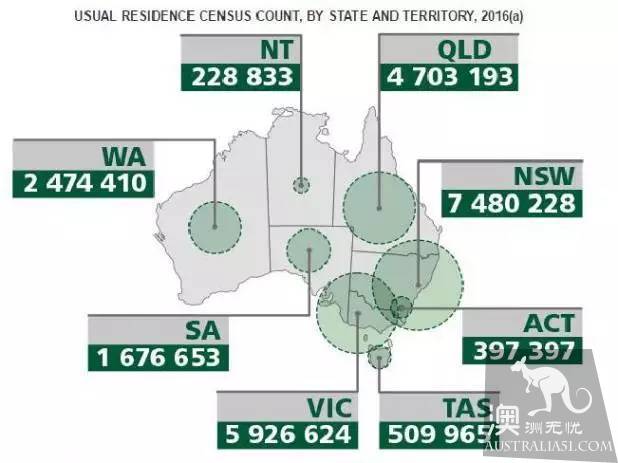
3、维州人口为5,926,624;新南威尔士州人口为7,480,228;昆士兰州4,703,193。
4、 去年8月份,人口普查登记的墨尔本人一共有4,485,211人;悉尼有4,823,991人。墨尔本必将取代悉尼,成为澳大利亚人口最多的城市
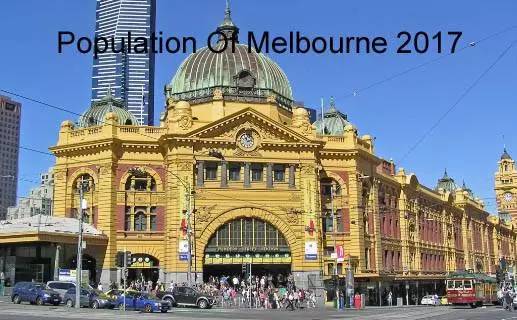
5、但是,过去5年中,墨尔本每周新增1859人,人口增速为12.1%。悉尼每周新增1656人,人口增速为9.8%。墨尔本必将取代悉尼,成为澳大利亚人口最多的城市。

6、达尔文是澳大利亚人口增速最快的城市,达到13.5%。
7、其次是珀斯,为12.5%。
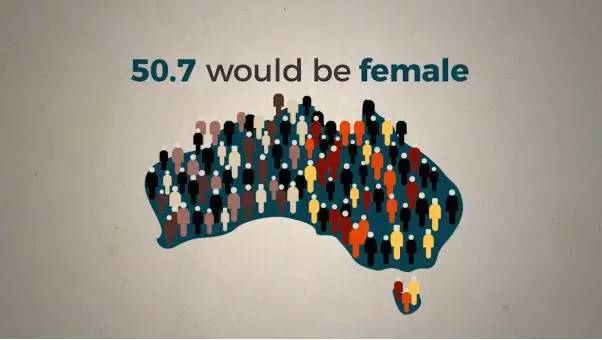
8、如果将澳洲比作一个100人的小村庄,那么在这100人中,49.3名是男性。

9、50.7名是女性。
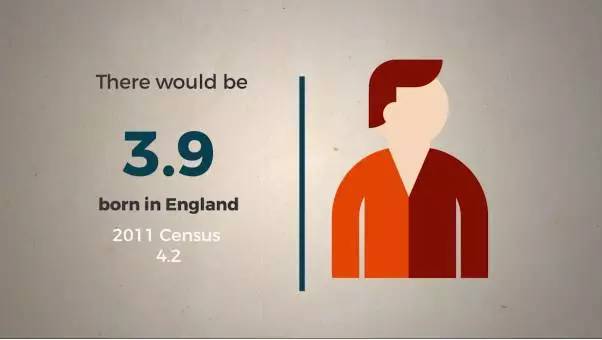
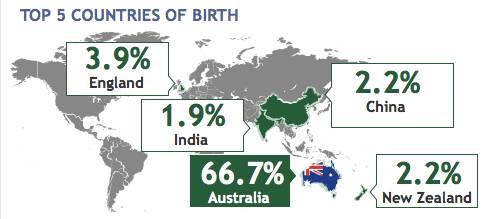
10、相比50年前,这个小村庄更加的多元化,其中3.9名是出生在英格兰,相比2011年的4.2名,下降了0.3名。
11、2.2名是出生在中国,相比2011年的1.5名,增长了0.7名。

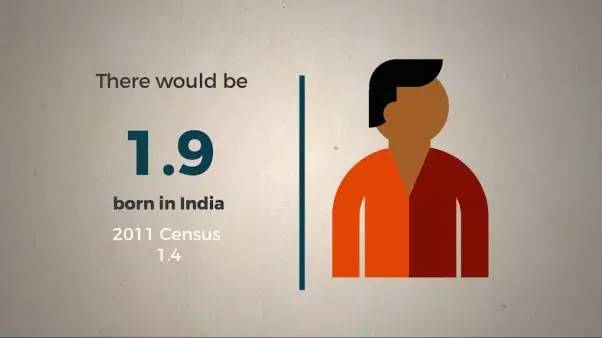
12、1.9名是出生在印度,相比2011年的1.4名,增长了0.5名。
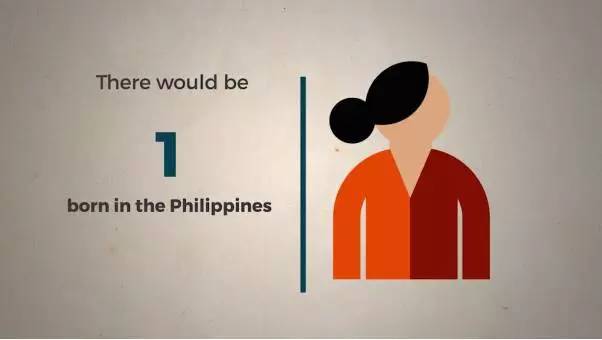
13、1名是出生在菲律宾。
14、同时,村庄里面的宗教信仰也是多元化的,29.6名是没有任何宗教信仰的。(按照总人口算的话,过去5年中,无宗教信仰的人数从2011年的4,693,162人增加到2016年的6,933,708人)

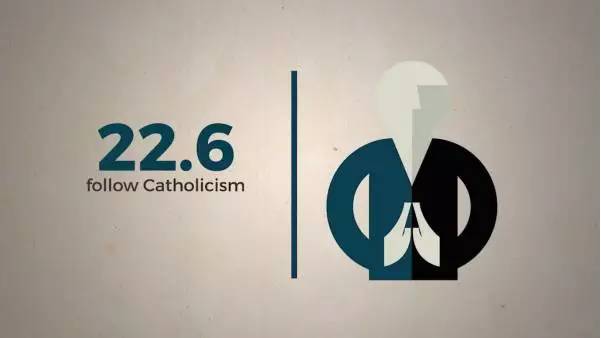
15、有宗教信仰的人数减少,其中22.6名是信奉天主教。(换算成总人口为5,291,834人)
16、有0.5个锡克教教徒(换算成总人口为125,900人);0.4个犹太教徒(总人口91,000人),0.8个其他宗教(总人口为186,700人);澳洲的佛教徒来自越南的最多,为26%。
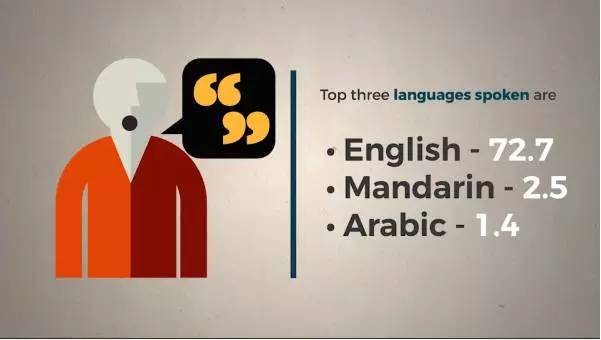
17、有2.6名是穆斯林,这个人数比1991年增加了160%。

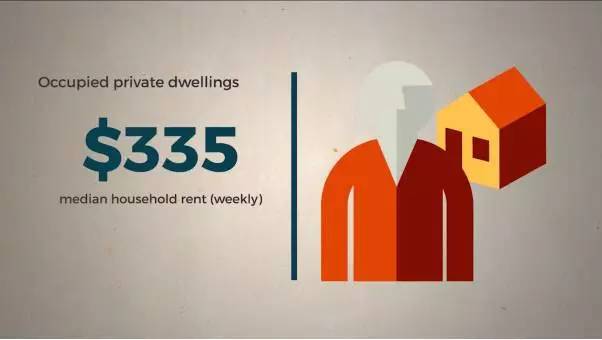
18、澳洲最常使用的语言分别为,英语(72.7名)、普通话(2.5名)、阿拉伯语(1.4名)。
19、在房租这一块,私人住宅的房租中位价格是$335一周。
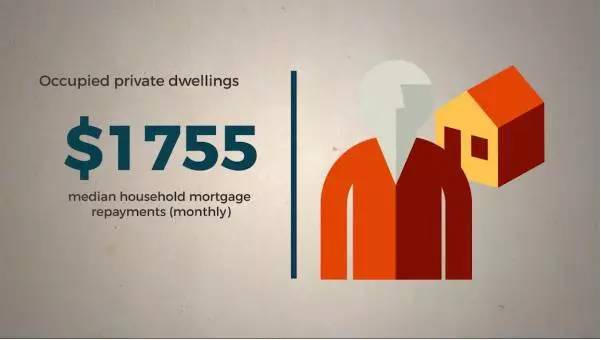
20、私人住宅的按揭贷款中位数是$1755一个月
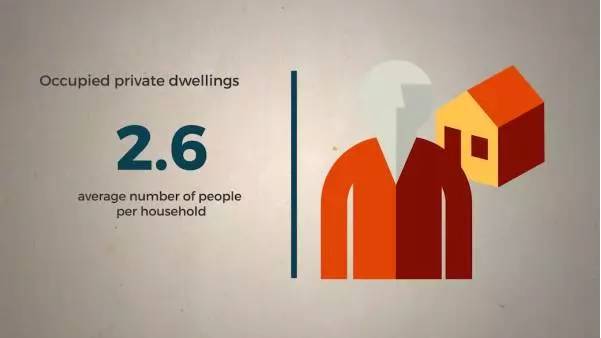
21、平均一户人家有2.6名居住成员。
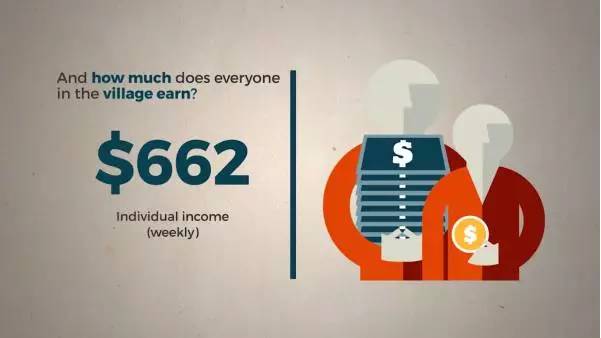
22、平均每个人一周的收入是$662。
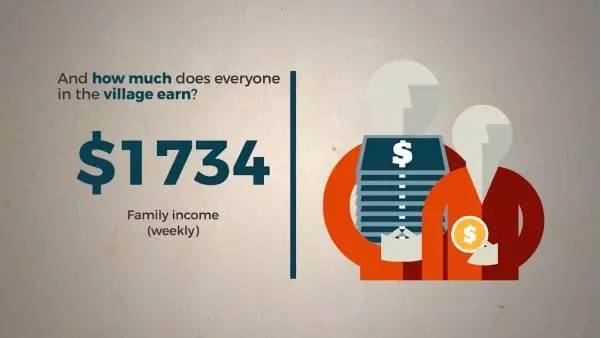
23、一个家庭一周的收入是$1734(以家庭为单位)。
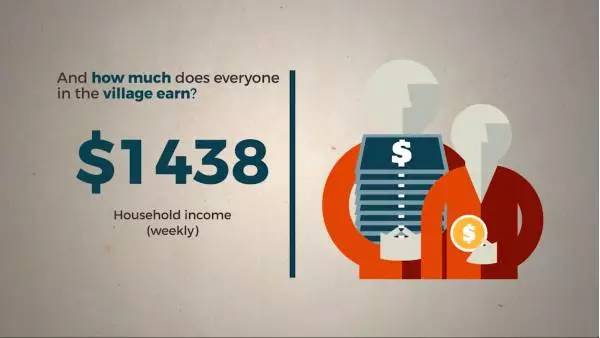
24、每户一周的收入是$1438(以房屋为单位)。
25、在澳洲的婚恋关系中,结婚人口占有48.1%,从2011年的48.7%下降了0.6%,不婚主义者占有总人口的35%。
26、44.7%的家庭组成是夫妇加孩子,37.8%的夫妇还没有孩子,15.8%的家庭是单亲家庭。
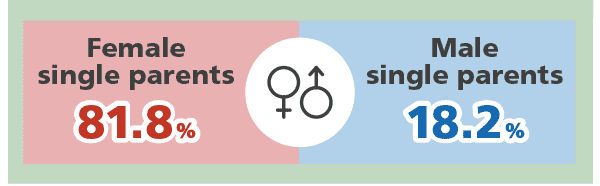
27、其中女性单亲家庭比例为81.8%;男性则为18.2%。
28、分居的人数占总人口的3.2%,离婚的人数占总人口的8.5%,寡妇占总人口的5.2%。
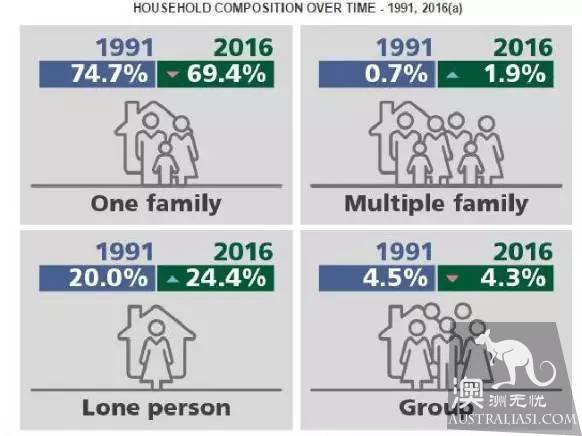
29、独生子女占比从1991年的74.7%下降到2016年的69.4%,下降5.3%。
30、多子女家庭占比从1991年的0.7%上涨到2016年的1.9%,上涨1.2%。

31、独居人数占比从1991年的20%上涨到2016年的24.4%,上涨4.4%。
32、群居人数占比从1991年的4.5%下降到2016年的4.3%,下降0.2%。
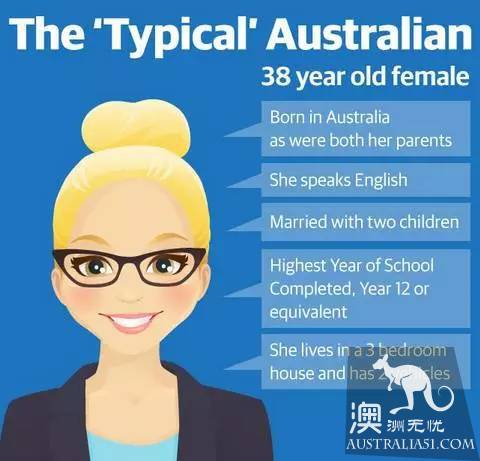
33、2016年的澳洲人口年龄中位数是38岁,比2011年的37岁上涨了一岁。
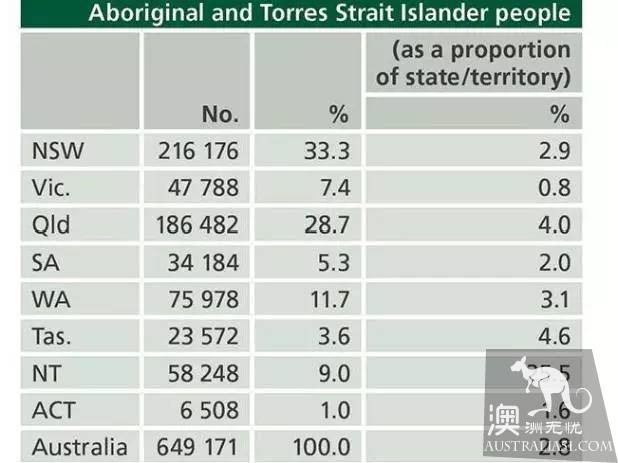
34、在澳洲,50.7%是女性,男性占有49.3%。女多男少啊!
35、关于原住民,在2016年中,澳洲一共有649,171名原住居民,占总人口的2.8%;相比2011年的数据,多了10万人。
36、关于国籍,父母双方均为澳大利亚人的群体在总人口中所占的比例下降:2006年为57%;2011年为54%;2016年为50.7%。
37、出生在海外的人数增加:2011年为5,280,802人;2016年增加到6,150,191人,占总人口的26.3%;
38、从国家来看,出生在英国的澳洲人是最多的,为907,570人;其次是新西兰,为518,466人;
39、中国排在第三,为509,555人;
40、印度排在第四,为455,389人;
41、菲律宾排在第五,为232,386人。
42、从地区来看,出生在亚洲的澳洲人数量首次超过了欧洲。过去5年中,澳大利亚的新移民数量为130万,其中,来自中国和印度的移民数量是最多的,分别为191,000人和163,000人。
43、维州的移民数量占到总人口的28%。
44、 澳大利亚人说的最多的四种语言分别为:
-
英语:17,020,417人,占总人口的72.7%;
-
普通话:596,711人,占总人口的2.2%(2011年为1.6%);
-
阿拉伯语:321,728人,占总人口的1.4%;
-
粤语:280,943人,占总人口的1.2%;
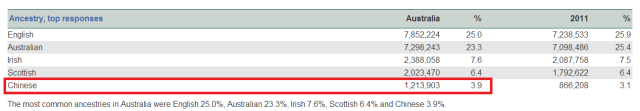
45、全澳华人人口总数约为121.39万,占到总人口数的3.9%。
46、维州有华人370,644人,占到维州总人口的4.7%,新州有华人514,594,占到新州总人口5.2%。
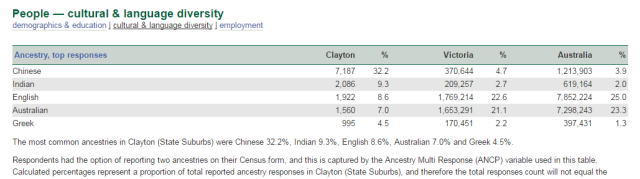
47、维州Clayton 区华人人口占到32.2%。
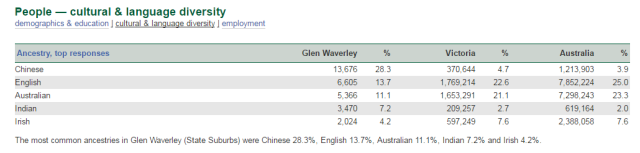
48、维州Glen Waverley华人比例28.3%
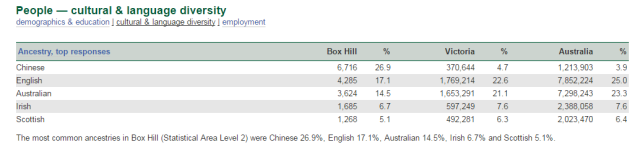
49、维州Box Hill 区华人比例为26.9%。
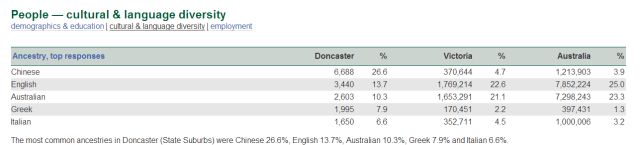
50、维州Doncaster华人比例26.6%。
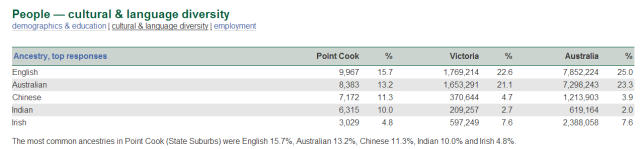
51、维州Point Cook华人比例11.3%
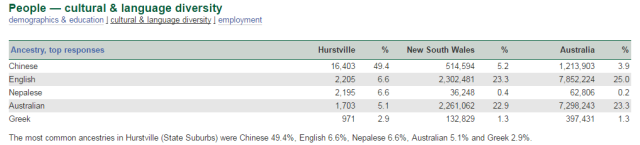
52、不过维州这些区的华人比例都不如悉尼华人区—— Hurstville 区,华人比例高达49.4%,真的是半壁江山!
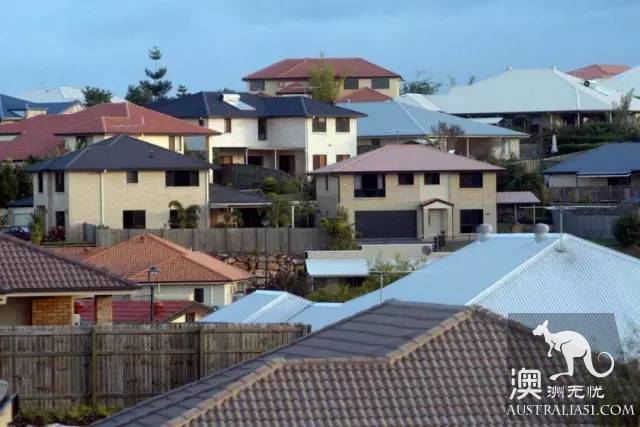
53、关于住房, 25年前,41%的澳大利亚人拥有自己的住房(无房贷),2016年这一数字为31%;
54、25年前,27.%的人拥有自己的住房(有房贷),2016年这一数字为34.5%;

55、25年前,26.9%的人租房住,2016年这一数字为30.9%。
56、2011年,澳大利亚一共有7,760,314套私有房产,2016年这一数字增加到了8,286,073套。

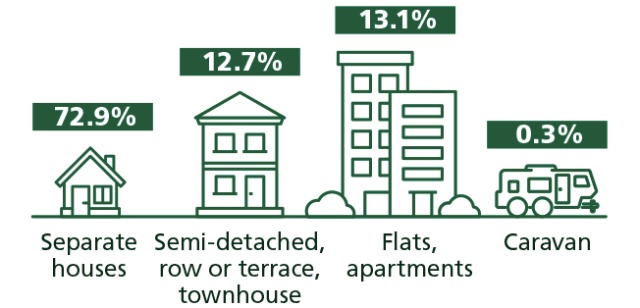
57、澳洲的住房类型中,独立住宅比例为72.9%;
58、半独立的连排别墅比例为12.7%;
59、公寓比例为13.1%;可居住的拖车比例为0.3%。
60、2011年,每周房租的中位数为$285,2016年增加到了$335。
61、2011年,澳洲人每月房贷的中位数为$1800,2016年降到了$1755。
62、澳洲人口老龄化问题日趋严重,65岁及以上的老年人占到了总人口的16%;
63、15到64岁占了65.6%的总人口。

64、0-14岁的青少年占了18.7%的总人口,这个比例有所下降,只有土著居民和托雷斯海峡的居民(Torres Strait Islanders)例外,在这两个群体中,儿童和青少年贡献了大多数的人口增长。
65、85岁及以上的老年人数量达到50万人。
66、 下一次的人口普查将在2021年举行。
这样一份数据,将对很多政策的修订,包括商业计划的确定至关重要,很多人从中看到了转变和机会,比如,日渐庞大的华人群体已经成为澳洲休戚相关的主体,下一个5年,值得期待。

