
文/朱振鑫 如是金融研究院首席研究员,杨芹芹 如是金融研究院高级研究员
本集摘要
1、中国大陆核心城市中心城区房价仅次于香港、伦敦、新加坡,如果剔除建筑和使用面积的差别,京沪深房价排全球第2-4位,仅次于香港。
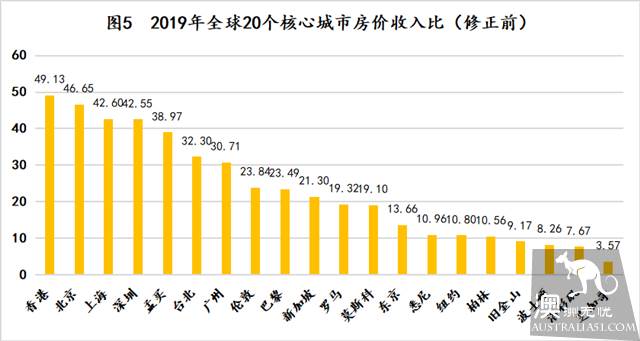
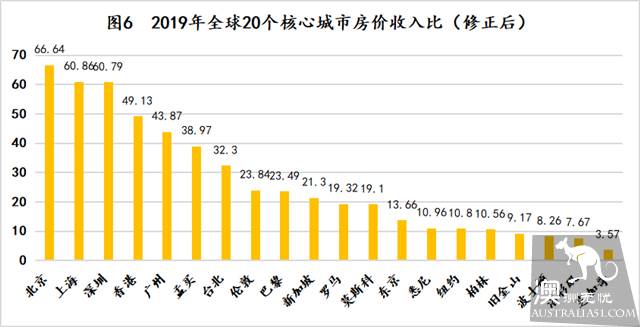
2、京沪深中心城区的房价收入比超过40倍,家庭储蓄四十年以上才能买到一处中心城区普通住宅,买房负担极重,修正前仅次于香港,修正后全球最高。
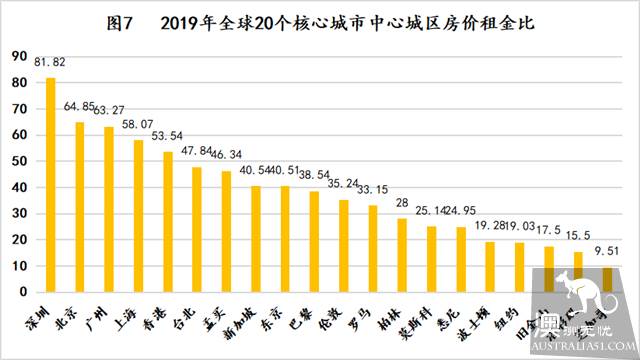
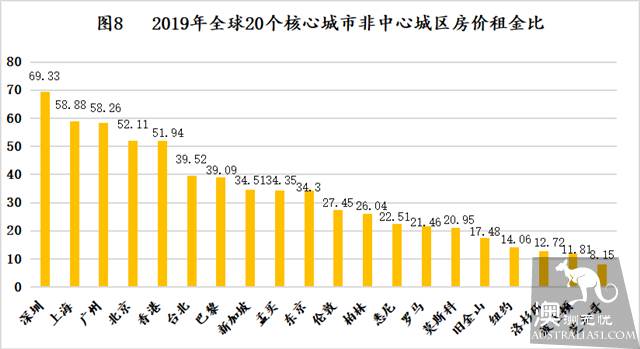
3、京沪深中心城区和非中心城区的房价租金比全球最高,远超过国际通行临界点25,要么是房价高估,要么是租金低估。
4、全球大部分核心城市都面临高房价的难题,尤其是香港,比内地的房价高的多。不能以单纯的房价高低、收入或者租金比来判断房价是否合理,即便有高估,也不一定会崩溃,至少短期不会。
5、我们用1000万可以买什么样的房子对各城市进行了对比,京沪深买房用来居住的性价比几乎是全球最低的。从全球来看,中国的房价到底有没有泡沫?这是一个难以回答的问题。国际对比是一个很好的参考,但直接拿中国和国外房价对比非常危险,因为中国的房价太不一样。
一是计价基础不一样。中国的“房产”和“地产”其实是分离的。土地为国家所有,住户只有土地使用权,普通住宅产权为70年,期满可以自动续期,商住两用房屋产权多为50年,需要缴纳一定比例的土地出让金进行续期;而国外多为永久产权,如美国采用私有财产制,房屋的买卖包括土地,产权是永久的。这意味着我们的房价中其实只包含了土地的一部分使用价值,而国外的房价中完全包含了土地的产权价值。
二是数据质量不一样。国内的数据主要有两个来源,一个是统计局,另一个是中国指数研究院。两个数据质量都不高,尤其是统计局的。一方面统计局只公布指数,没有高频的绝对价格。另一方面数据严重失真。统计局数据来自住建部门的网签价,而为了合理避税,大城市普遍存在阴阳合同,网签价基本都大幅低于实际成交价。举个例子,假设北京一套房子实际成交800万,但一般网签价只做到468万的普宅最高指导价。按照统计局的数据,北京2016年的新房成交均价才2.8万/平米左右,而实际均价早已经五万以上。拿着这种房价去对比分析,结论必然跑偏。
三是统计口径不一样。全球房价缺少一个统一的官方数据,各国房价统计机构不同、数据来源不同,样本口径也不同,不适合直接比较。国内常用的房价数据是70个大中城市和百城房价,样本城市相对较多,包含了各种商品房类型;而美国最常用的标普/凯斯·席勒房价指数则只统计20个城市,而且还只统计独栋和联排别墅。别说各国之间没法直接对比,甚至是一国内部直接比较都不完全准确。
四是面积算法不一样。国内房屋计算的是建筑面积,既包括住房使用面积、墙体占用面积,也包括了公摊面积,楼道、阳台等都计入其中。大多数国家地区计算的是实用面积或使用面积。如香港采用的是实用面积,等于建筑面积去除公摊面积的部分。而美国、英国等使用是使用面积,等于实用面积减去墙体占用面积,也就是真正能够使用的住宅面积。
三种面积之间的关系是建筑面积>实用面积>使用面积,实用面积和使用面积相差较小,建筑面积与使用面积存有较大差异,需要用得房率进行换算,也就是实际居住面积和建筑面积之比。一般来说,塔楼或是带电梯的住宅得房率约为70%,多层住宅或是不带电梯的楼房得房率约为75%,也就是说国外70多平的房子大概相当于国内100平。中国房价要除以得房率才能得到可与国外对比的实际房价,这至少要比原有的房价数据高出30%。
五是持有成本不一样。国内现行的房地产税费主要体现在交易环节,多为一次性成本,只有房产税和城镇土地使用税是针对房产持有环节的,但房产税目前只有在上海和重庆进行试点,还未全面推出。也就是说如果不交易,中国房屋持有几乎无成本。而国外税费主要在持有环节,持有成本较高,德国、美国、日本、新加坡、英国、香港等很多国家和地区都有房产税,需要在持有期间缴纳。比如北京一套100平左右的房子持有成本只有每年四五千元的物业费,而在临近华尔街的FLATIRON公寓每年需缴纳1.16万美元/年的房产税和0.85万美元/年的物业费,折合人民币年均持有成本13.47万元,持有成本明显高于国内,这部分成本其实也算是隐性的“房价”。
六是区域结构不一样。中国是后发国家,城镇化率还不到60%,区域发展极不均衡,城市和农村、核心城市和三四线城市之间差异很大,如同为省会城市,杭州均价超过6万,乌鲁木齐均价在6千左右,相差有十倍。国外虽然也有区域和城乡差距,但发达国家城镇化率基本都在70%以上,不像国内分化这么严重。这导致一个问题,如果比较整体房价,中国的房价可能会被部分落后地区以及农村拉低,掩饰大城市的高房价,和实际情况不符。
七是计价单位不一样。各国采用的房屋面积度量单位千差万别,国内是平方米,美国和英国是平方英尺,日本和韩国是坪,都需要经过一定的换算,无法直接比较。三者之间的换算比例为1平方英尺约等于0.093平方米,1坪约等于3.31平方米。
既然数据不一样,那直接对比很容易产生系统性偏差。为了对比的准确性,我们综合考虑各种因素,确定以下几个数据处理的原则:一是以发展程度近似的代表性城市进行对比,避免整个国家对比的不准确性;二是以市场数据为准,避免外部干预带来的数据失真;三是以同一跨国统计机构为准,避免统计口径的不同;四是宏观的数据维度和微观的案例维度相结合,尽可能的反映房价的真实情况;五是绝对水平和相对水平相结合,剔除发展水平差异带来的房价差异。
接下来,我们就从这几个原则出发,分布从宏观和微观两个视角来对比一下中国和其他国家的房价。

宏观视角对比:几乎是全球最高
宏观层面上,我们选取Numbeo的数据,这是目前世界上最大的在线协作数据库网站,通过用户在线协作实现全球国家和城市生活成本信息实时更新,便于进行数据比较。为提高可比性,我们选取全球最具代表性的全球核心城市作为样本,具体包括北京、上海、广州、深圳、香港、伦敦、新加坡、纽约、旧金山、巴黎、波士顿、东京、悉尼、洛杉矶、孟买、罗马、柏林、台北、莫斯科、芝加哥等20个城市,自上而下分析全球核心城市的绝对房价和相对房价水平。
绝对房价:修正后仅次于香港。
我们直接选用一线城市中心区域和非中心区域平均房价进行对比,可以发现中国一线城市京沪深中心城区平均房价名列前茅,但和排名靠前的香港、伦敦和新加坡相比还有一定的差距。根据Numbeo最新2月份核心城市中心城区的房价数据,香港以29147美元/平方米遥遥领先,紧随其后的是伦敦和新加坡,分别为17532美元/平方米、16473美元/平方米,北京、上海、深圳分别以15292美元/平方米、14221美元/平方米、13349美元/平方米的价格位居第四、第五、第七,排名十分靠前,北京、上海中心城区房价已超过纽约,深圳超过旧金山、巴黎、东京等国际一线大城市。
由此可见,中国内地一线城市京沪深房价位居前十,在全球处于领先地位,比肩纽约、旧金山、巴黎等全球知名城市,但与排名靠前的香港、伦敦和新加坡相比,仍存在一定的差距,京沪深中心城区房价约为香港的一半。
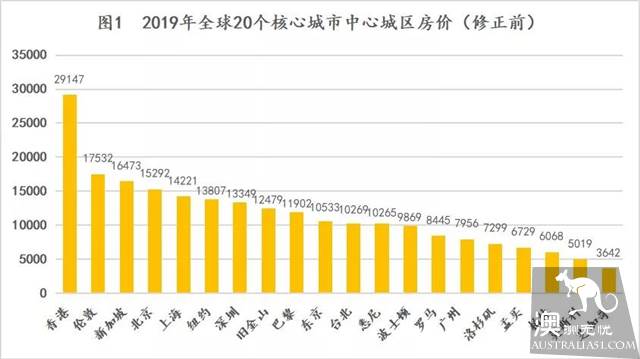
资料来源:Numbeo、如是金融研究院 单位:美元/平方米
但是考虑到中国内地常用的为建筑面积,核心城市多为带电梯住宅,选用70%的得房率,进行折算后可以发现,北京、上海和深圳中心区域实际房价分别为21846美元/平方米、20315美元/平方米和19069美元/平方米,已经超过伦敦和新加坡,仅次于香港,且与香港差距进一步缩小。
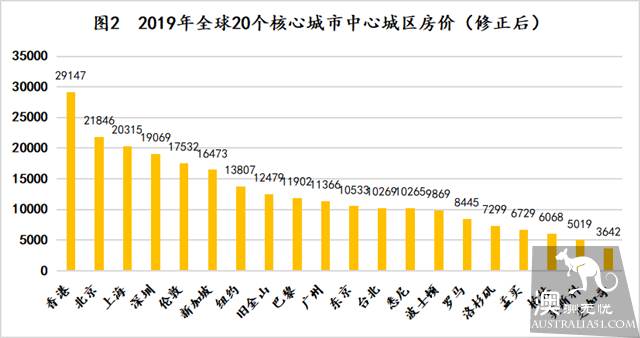
资料来源:Numbeo、如是金融研究院 单位:美元/平方米
再来看一下非中心城区:20个全球核心城市非中心城区房价与中心城区差距明显,部分城市非中心城区房价不到中心城区的一半,但非中心城区总体排名几乎无变化,仅有个别城市调换顺序。根据Numbeo网站最新2月份核心城市非中心城区的房价数据,北京、上海、深圳分别为7483美元/平方米、7213美元/平方米、7145美元/平方米,约为中心城区的一半,位居第六、第七、第八,排名依然靠前,但相对中心城区排名有所后移。
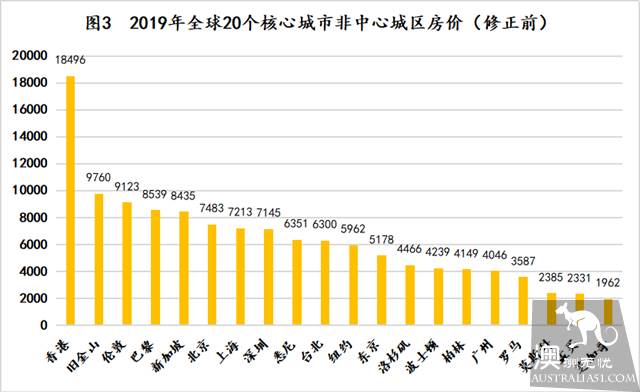
资料来源:Numbeo、如是金融研究院 单位:美元/平方米
非中心城区也按照70%的得房率进行折算后,北京、上海和深圳非中心城区房价分别为10691美元/平方米、10304美元/平方米和10208美元/平方米,仅次于香港,成功超过旧金山、伦敦、巴黎和新加坡等国际大都市。
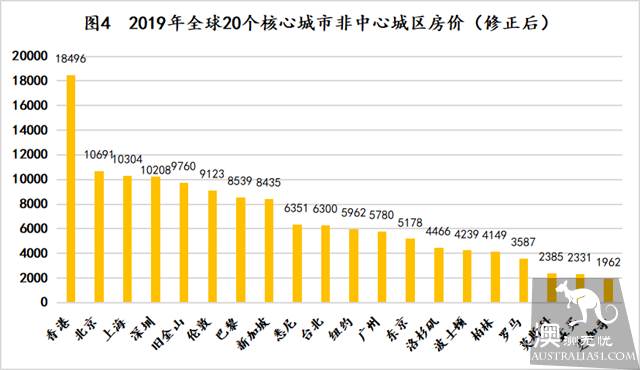
资料来源:Numbeo、如是金融研究院 单位:美元/平方米
相对房价:全球最高,没有之一。
第一个指标是房价收入比:修正前仅次于香港,修正后全球最高。一般用于衡量房价相对居民收入的合理程度,比如京沪深中心城区的房价收入比超过40倍,意味着家庭储蓄四十年以上才能买到一处中心城区普通住宅。Numbeo网站采用的是公寓价格中位数与家庭可支配收入中位数的比值,公寓价格选用中心区域和非中心区域房价均值,公寓中位数为90平方米,假设50%为女性劳动力,净可支配家庭收入定义为1.5倍平均净工资,在最新2月份核心城市中心城区的房价收入比数据中,香港以49.13排名第一,北京、上海、深圳的房价收入比分别以46.65、42.60、42.55位居第二、三、第四,遥遥领先其他城市。
注意,这还没有按得房率折算,如果用折算修正后的房价去计算房价收入比,那京沪深更是高的惊人,分别达到66.64、60.86和60.79,远远超过香港,成为全球买房负担最高的城市。
资料来源:Numbeo、如是金融研究院
资料来源:Numbeo、如是金融研究院
第二个指标是房价租金比:全球最高。从直观上说,每平方米的房价与年租金之比,度量房屋出租取得的投资回报情况,可用于判断是买房还是租房划算。再进一步说,租金更能反映实际的居住需求,房价如果相比租金高出很多,那意味着房价存在投机炒作的金融成分,可以理解为存在泡沫。
京沪深的中心城区和非中心城区的房价租金比均位于前列,租房的性价比要高得多。Numbeo在估算每平方米租金时假设一卧室公寓有50平方米,三卧室公寓有110平方米,未考虑税收或维护费用。在最新2月核心城市房价租金比数据中,深圳、北京、广州、上海中心城区的房价租金比分别以81.82、64.85、63.27、58.07位居前四,非中心城区也是如此,占据前四位。国际通行的临界点是25,超过临界值表明该区域房产投资价值变小,租房比买房更加经济。如前所述,租房的都是实际居住需求,买房的有些是投机需求,房价租金比高说明投机需求超过了实际居住需求,有一定的泡沫。
资料来源:Numbeo、如是金融研究院
资料来源:Numbeo、如是金融研究院

微观视角对比:1000万在各国核心区能买什么房子?
宏观上的数据更全面,但可能也意味着更多的误差。我们可以再从微观层面进行一些感性的对比,有时反而更贴近现实。微观对比无非两种思路:一种是同样的地段和房子对比房价,另一种是同样的价格去对比房子。我们把这两种方法结合一下,从购房者角度出发,假定现在手头上有1000万左右的预算,投资地点限定在全球各大城市最核心的金融区,然后去寻找可以买到的房子进行自下而上的对比,由此也可以对全球各地的房价有个直观的感性认识。
1、香港:中环汇贤居 总价991万 2卧 实用面积41平方米
香港国际金融中心附近中上环太平山高街1号汇贤居一处住宅,楼龄12年,底层西向,建筑面积615尺(合57平方米),实用面积仅为443尺(合41平方米),实用率72%,总价1150万港元(合991万人民币),单价高达24万/平方米,全球排名靠前。但整体配套较为齐备:一是交通设施便利,距离最近的地铁站西营盘500米左右,步行到国际金融中心15分钟,共有多条巴士路线经过,不到半小时就可到铜锣湾。二是教育资源丰富,附近共有17所小学,距离香港大学1公里左右。三是生活配套完善,附近有卜公花园、上环体育场、西营盘邮政局儿童游乐场等设施,可供休闲娱乐。
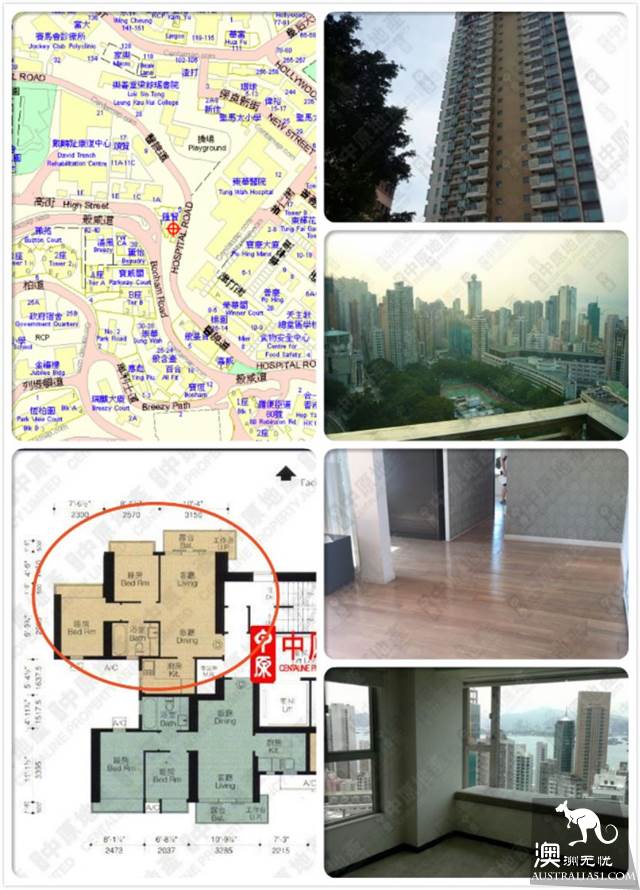
图片来源:中原地产
2、伦敦:伦敦金融城Park Vista Tower公寓 总价925万 2卧2浴 80平方米
伦敦金融城Park Vista Tower 2卧室现代公寓, 2017年8月份竣工,装修简洁舒适,位于14层,中高层,视野良好,可俯瞰伦敦壮观景色,室内面积80平方米,总价100万英镑(约925万人民币),单价为11.56万/平方米。Park Vista Tower公寓交通便利,处于伦敦中心城区,步行5分钟可至Wapping Station,有前往金融城和金丝雀码头的便利交通路线,约15分钟车程。Wapping区内教育资源丰富,有16所幼儿园及托儿所、70所小学、16所中学、7所特殊学校、19所私立学校和皇家玛丽学院和伦敦城市大学两所大学。
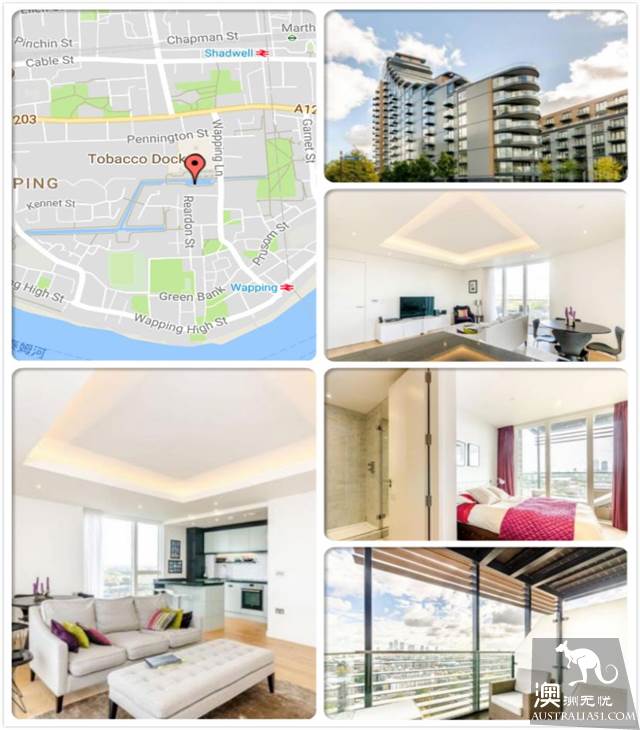
图片来源:欧洲购房网
3、新加坡:金融中心滨海湾嘉御苑 总价1009万 3卧2卫 112.6平方米
新加坡嘉御苑3卧2卫高级公寓,2018年1月份竣工的新房,精装修,房屋面积112.6平方米,总价211万新币(约1009万人民币),单价为8.96万/平方米。嘉御苑公寓交通便捷,处于中心核心区域的第3邮区,开车5分钟即能到达乌节路购物区,步行10分钟到红山地铁站(Redhill),四站地铁可抵达中央商务区CBD,附近有伊丽莎白医院,项目周边设施便利完善,从公园可步行至滨海湾花园。教育资源丰富,有亚历山大小学、女皇镇小学、颜永成小学、克信女中、红山中学等多所中小学和新加坡国立大学、新加坡理工学院,新加坡管理大学等高校。
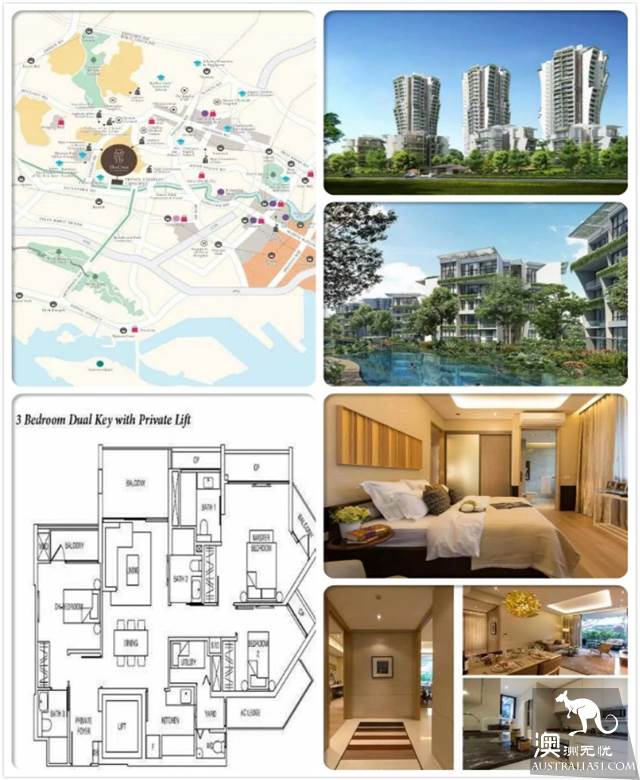
图片来源:链家
4、上海:陆家嘴附近世茂滨江花园 总价950万 1室2厅 85.07平方米
陆家嘴附近世茂滨江花园的1室2厅,2009年建成,精装修,满五不唯一,建筑面积85.07平方米,总价950万,单价为11.17万/平方米。世茂滨江花园位于内环核心区域,有四条地铁和四条公交线路通过,其中距离最近的9号线商城路1000米左右,一站地铁可至陆家嘴金融中心,附近2公里范围内有大型三级甲等综合性医院上海市东方医院。教育资源优质,有浦东新区明珠小学、浦明师范附属小学等重点小学。生活娱乐配套完善,距离上海第一八佰伴商圈不到1000米。
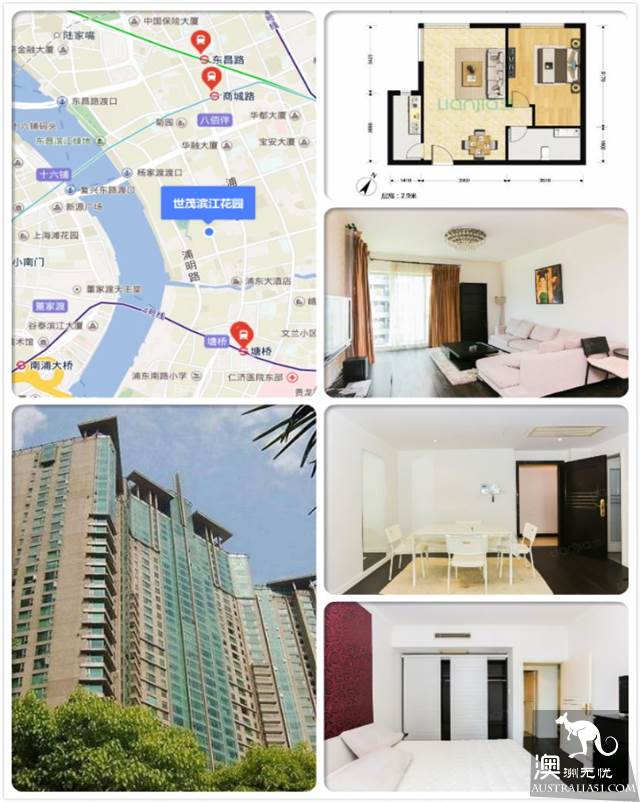
图片来源:链家
5、北京:金融街晶华小区 总价1000万 1居室 78.24平方米
金融街西城晶华小区精装修一居室,2008年建成,满二不唯一,建筑面积78.24平方米,总价1000万,单价为12.78万/平方米。晶华小区位于二环内,距离金融街不到800米,小区西门就是公交站,有三条公交路线经过,往西有地铁2号线阜成门站,往东有地铁4号线西四站和灵境胡同,均不超过1000米。周边教育资源丰富,有实验二小幼儿园(知名幼儿园)、北师大附中(北京市首批重点中学)、北京八中(北京市示范重点中学)、中央音乐学院(中国最高等音乐学院)等重点学校。周边配套齐全,医疗条件良好,距离北京大学人民医院(白塔寺院区)500左右、北京协和医院西院1000米左右。生活娱乐便利,小区西侧距离金融街购物广场约800米,到西单商场约1500米。
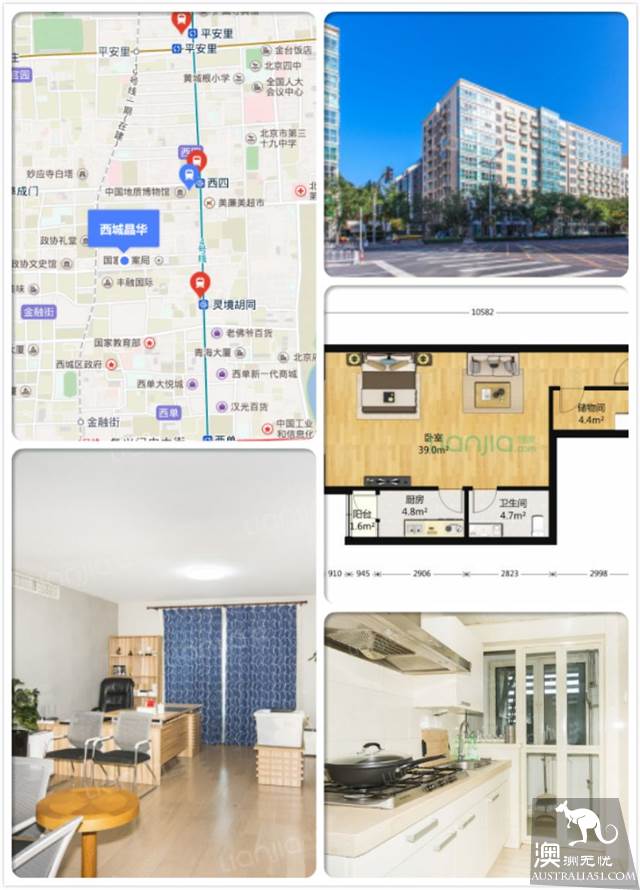
图片来源:链家
6、纽约:曼哈顿下城区FLATIRON公寓 总价920万 1居室 66平方米
纽约曼哈顿下城区邻近华尔街的精装修一居室公寓,1989年建成,总价920万元,使用面积66平米,单价为13.94万元。公寓位于曼哈顿下城区繁华街道,转角就是华尔街,靠近联合广场公园,交通十分便利,距离6街地铁和14街地铁F、M、L,1.2.3号线及14街地铁和9街地铁PATH距离500米左右,出行十分方便。周围教育资源丰富,有纽约排名No. 6、全美排名No. 38的New Explorations Into Science, Tech and Math High School和纽约排名No. 10、全美排名No. 61的New Explorations Into Science, Tech and Math High School及2016年世界排名53的纽约大学。
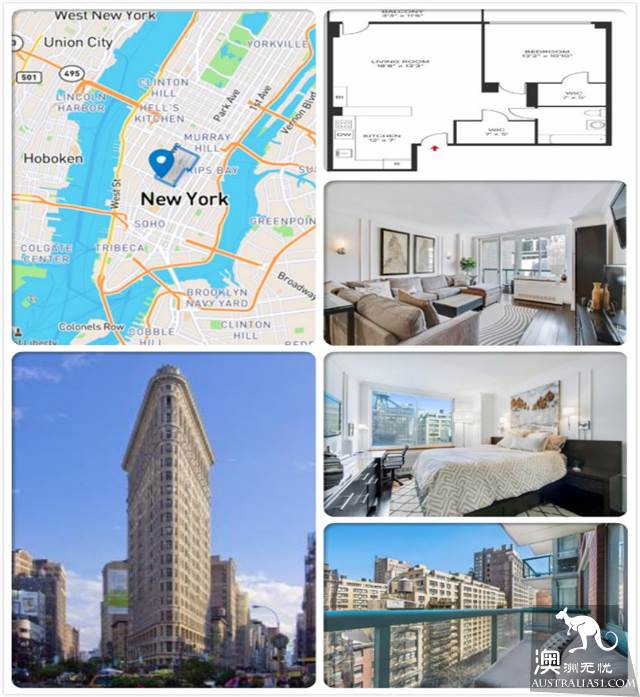
图片来源:北美购房网
7、深圳:福田区雅颂居 总价990万 2室2厅 86.99平方米
深圳福田区CBD附近的雅颂居,精装修,2室2厅,2004年竣工,总价990万元,建筑面积86.99平方米,单价为11.38万元。雅颂居位于市民中心附近,出行交通便利,100米内有三个公交站台,多条公交线路经过,不到2000米的范围内有9个地铁站点,距离最近的岗厦北和市民中心站约500米。周边聚集了大量的教育资源,小区自带维多利亚双语幼儿园,对口的天健小学为深圳市一级重点学校。
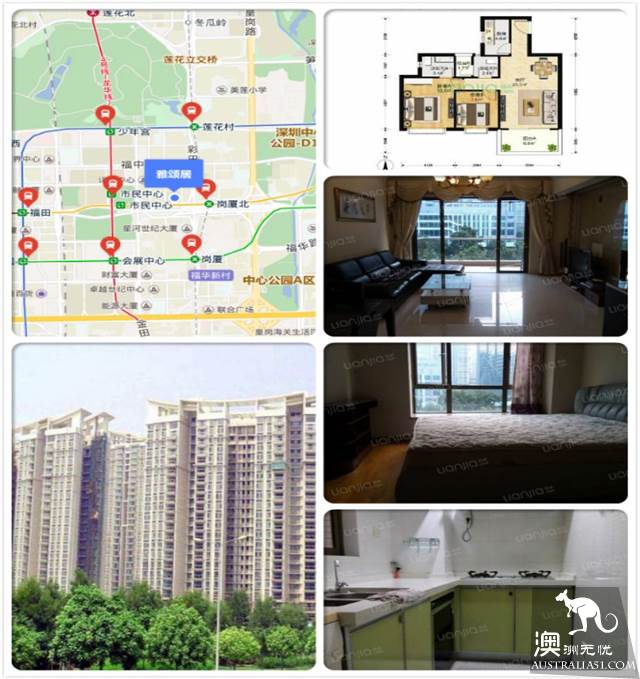
图片来源:链家
8、巴黎:第二大区复式公寓 总价926万 1卧1浴 83平方米
精装修复式宽敞公寓,朝向南面,1卧1浴,总价926万元,套内面积83平方米,单价为11.16万元。位于巴黎歌剧院为中心的第二大区,包括前巴黎证券交易所和多家银行总部,位置优越,交通便利,邻近地铁站,步行可达。基础设施完善,文化氛围浓厚。
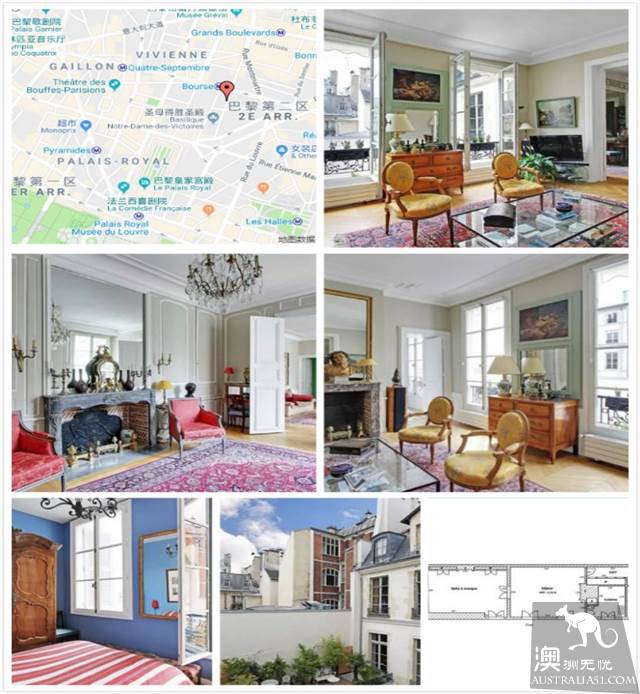
图片来源:欧洲购房网
9、波士顿:市中心公寓 总价1049万 1卧1浴 83平方米
波士顿市中心建造于2016年的优质公寓,1卧1浴,总价1049万元,室内面积83平方米,单价为12.64万元。公寓位于市中心Downtown Crossing街区,靠近地标性建筑千禧塔和波士顿公园,距离波士顿金融区仅数分钟路程,最近的公交站和地铁站距离不到100米,交通十分便利。教育资源丰富,包含多所中小学,如Adams Elementary School、Josiah Quincy Elementary School、Eliot Elementary School等。
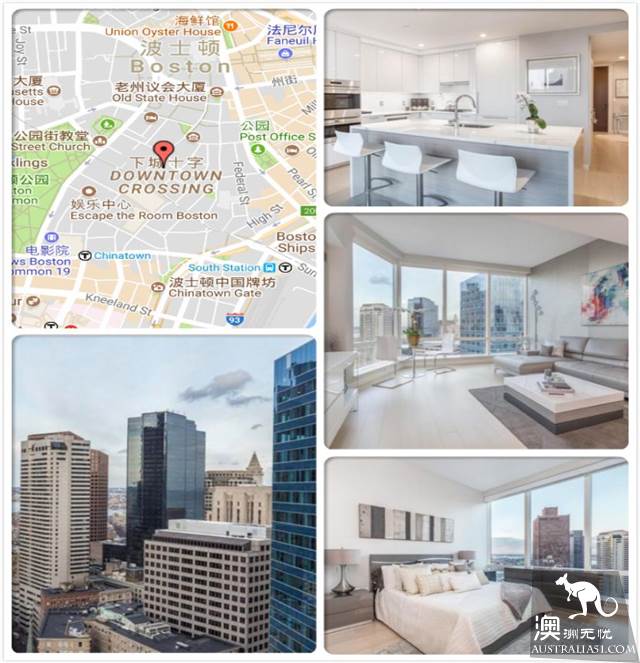
图片来源:北美购房网
10、东京:新宿区富久町Tomihisa Cross Comfort Tower公寓 总价930万 3卧1浴 75平方米
东京新宿区建造于2015年的Tomihisa Cross Comfort Tower公寓,3卧1浴,位于47层,视野极佳,东京夜景一览无余,总价930万元,室内面积75平方米,单价为12. 4万元。公寓坐落于新宿区富久町,交通十分便捷,有3个车站、3条线路可以搭乘,最近的车站是新宿御苑前站,步行9分钟即可到达。周边设施完善,临近超市、保育园、商业设施等,生活便利。
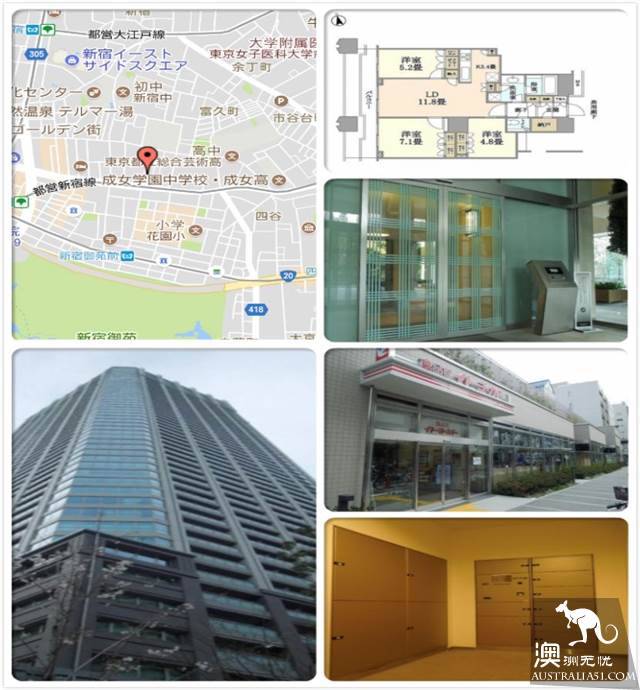
图片来源:亚洲购房网

结论
综上,对比的结论已经很清晰:
第一,从绝对水平来看,中国大陆核心城市的房价在全球位居前列,仅次于香港、纽约、新加坡,如果剔除建筑和使用面积的差别,京沪深的房价几乎是最高的,仅次于香港。
第二,从相对水平来看,中国的核心城市房价在全球是最高的,修正后的房价收入比和房价租金比都超过了香港,京沪深的购房负担稳居全球前三。
第三,如果房价没法进一步的上涨,目前的租金回报是严重偏低的,房地产作为一个投资品的属性会越来越弱。
第四,全球大部分核心城市都面临高房价的难题,尤其是香港,比我们的房价高的多。不能以单纯的房价高低、收入或者租金比来判断房价是否合理,即便有泡沫,也不一定会崩溃,至少短期不会。

新中产财富指北是如是金融研究院旗下的新中产财富研究品牌,致力于以独立第三方的研究视角,为新中产群体提供真实、客观、专业的财富知识和服务,帮助新中产甄别财富机会、规避财富风险,引领新中产的财富成长。