
澳大利亚媒体SBS最新统计澳洲华人移民分布地图曝光,从地图上可以看出中国移民主要集中在悉尼和墨尔本,尤其是悉尼华人区和墨尔本华人区的分布图,一片红旗飘飘,大有分分秒秒占领澳洲之势。
截至2013年6月,澳洲人口中包括640万移民,占总数的28%,较上年同期增加20万人,在10年间增加170万。而移民在西澳所占的比例更是惊人,目前有逾三分之一的西澳人口出生于海外。澳大利亚统计局人口事务负责人贾维斯(Bjorn Jarvis)表示,历次人口普查数据证明,海外出生居民在西澳人口中所占的比例在持续增长。
以全澳而言,出生于海外的移民中英国人最多,有逾120万英国人定居澳洲,排在第二位的是新西兰,有60.88万人,出生于中国的移民以42.76万人排在第三位,占了全国总人口的1.8%,排在第四位的印度则有36.97万人。
那么现在小编就让大家对中国移民在澳洲各个地区的华人分布有一个最主观的了解!图片和数据说明一切!
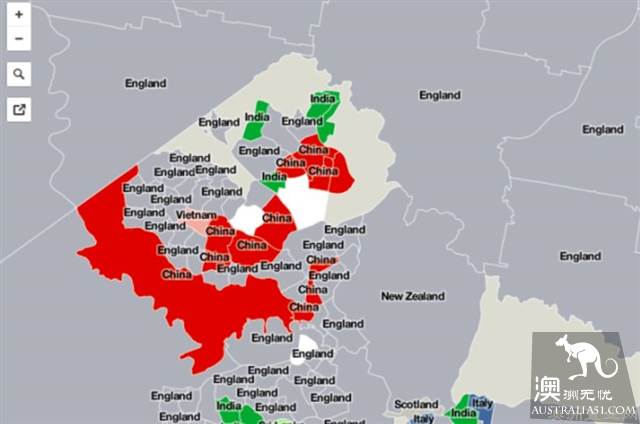
悉尼华人区
据不完全统计,据2011年澳洲人口普查统计,大悉尼区有讲华语人口358,064人,占大悉尼总人口4,391,674的6.5%。
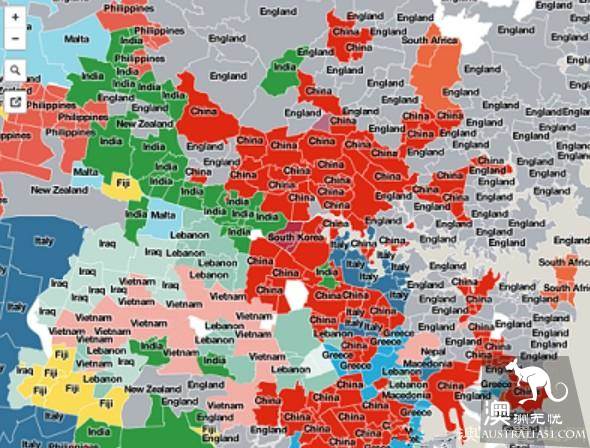
其中大陆出生的有148,558人,占3.4%;讲普通话的133,888人,占3.0%;讲粤语的132,135人,占3.0%。讲话语的人中还包括来自香港、台湾、越南、印度尼西亚、新加坡、马来西亚等世界各地移民悉尼华人。南部华人集中在好事维,西北部华人集中在eastwood,epping,carlingford一带,北部华人集中在chatswood,另外比较集中的地区还有campsie,burwood,asfield等悉尼华人区。
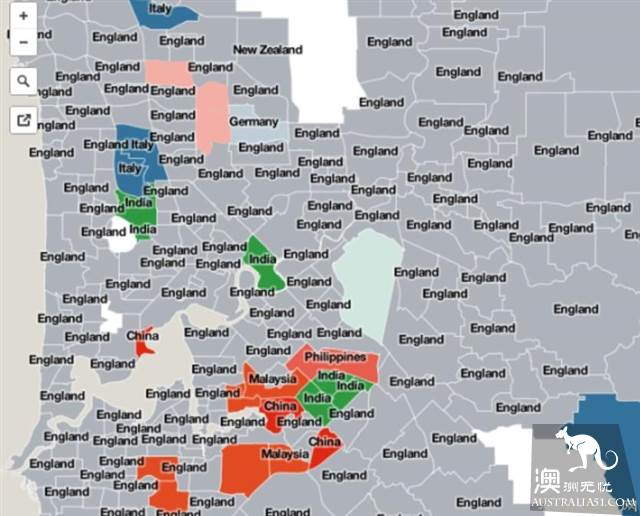
墨尔本华人区
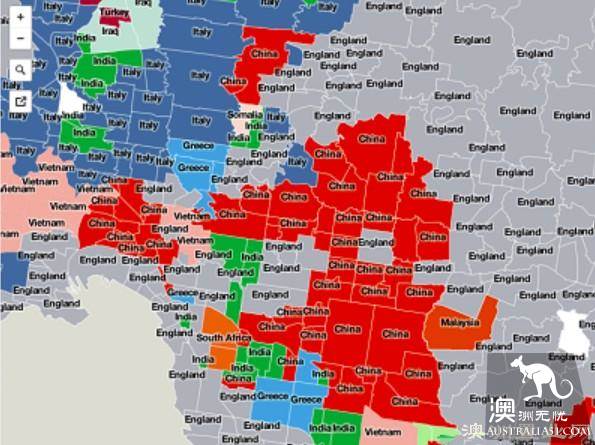
墨尔本400多万人口中,华侨华人人口超过了30万。墨尔本的华人约占澳洲华人人口总数的 26%。其中boxhill华人居多。
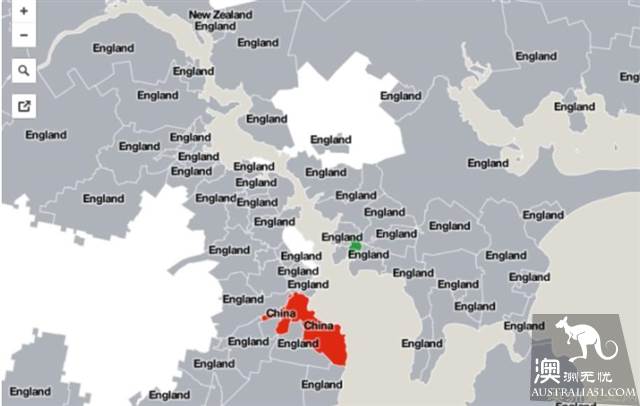
布里斯班华人区
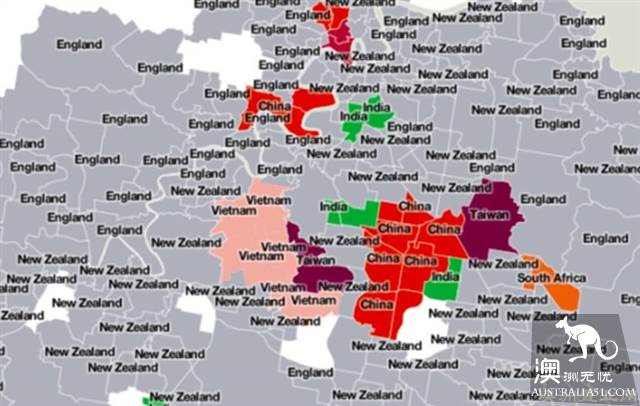
昆州有华人华侨约11万人,其中布里斯班有9万,黄金海岸1万,凯恩斯、汤斯维尔、罗克汉普顿市各有1000~2000人,图文巴、鲍文、麦凯等少数地市有百余人。其中sunnybank华人很多,唐人街反而华人没有那么多。
悉尼、墨尔本和布里斯班的华人占据了最主要的组成。而其他澳洲首府城市的华人也占了一定比例。
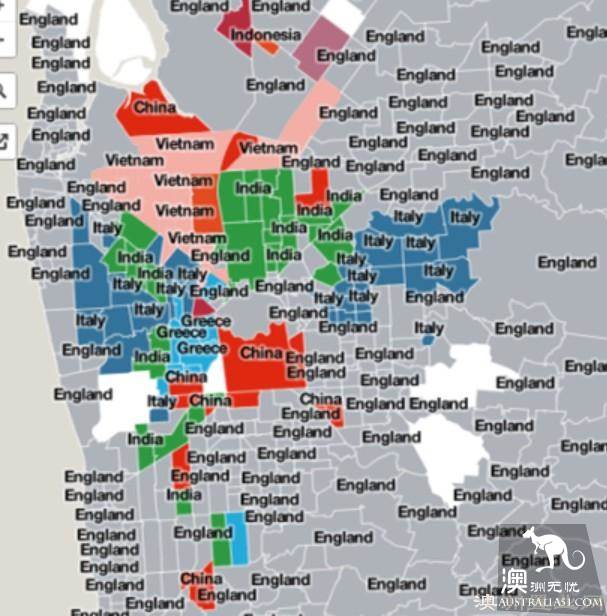
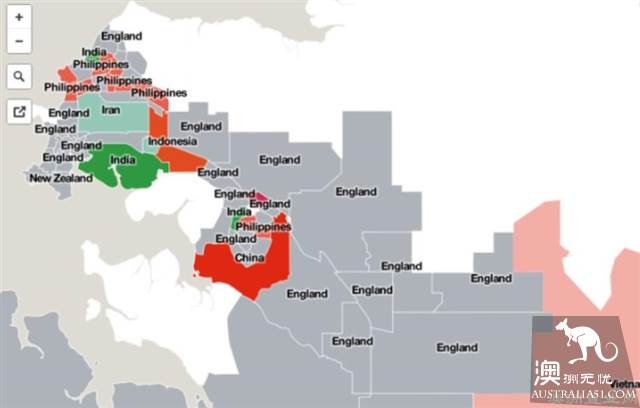
阿德莱德华人区
柏斯华人区
霍巴特华人区
达尔文华人区
堪培拉华人区
以各州和领地分别计算,西澳有78.65万居民不是在澳洲出生,占了全州总人口的33.4%。西澳也是海外移民比例增幅最大的州,比起2006年时的29.9%增加了4.5个百分点。目前西澳出生于英国的居民有25.61万人,新西兰有8.1万人,南非有3.98万人,出生于这三个国家的居民加起来占西澳海外出生人口的48%。
维多利亚州的海外出生人口比例仅次于西澳,为28.7%,即有158.98万人非在本国出生。出生于海外的维州居民中,生于英国的最多,有22.84万人;其次是印度,有12.68万人;生于中国的则有11.28万人,位居第三。而且维州还是出生于印度、意大利、越南和希腊及斯里兰卡的居民比例在全澳最高的地区,有2.3%生于印度,1.5%生于意大利,1.4%生于越南,1.1%生于希腊。
新南威尔士州的海外出生居民比例以28%在全澳排在第三位,最大的3个移民来源国依次为英国、中国和新西兰。出生于英国的居民有30万之多,出生于中国的则有19万人,生于新西兰的则有12.88万人。
首都领地以26%的海外居民率排在全澳第四,三大出生国分别是英国、中国和印度,其中有16.9万人生于英国,8000人生于中国,生于印度的则有6500人。北领地则是全澳出生于菲律宾的居民比例最高的地区,有1.9%的居民出生于这个东南亚国家。
澳大利亚海外出生居民比例最低的地区是塔斯马尼亚州,仅有13%的居民不是在澳洲出生,其中有2.5万人生于英国、5500人生于新西兰,还有2800人生于荷兰。
下一次澳大利亚人口普查会在2016年开始,倒时候华人移民的版图应该又扩大了很多。